One Repo to Rule Them All
A Data-Driven Look at Polkadot's Monorepo
Ah, January… that magical time of year when suddenly everyone turns into a philosopher, gazing deeply into the past and future. Naturally, we at Parity couldn't resist joining the trend.
Since moving all code to the monorepo back in August 2023, we felt that it boosted our productivity. Just to be sure, we decided to back up our intuition with some data and would like to introduce our Polkadot SDK repository data analysis made with the help of everyone in the Parity Data Team (real hot data shit 🔥).

For context, we have moved the development from our 3 repositories Substrate, Cumulus and Polkadot and consolidated it into the Polkadot SDK, which we refer to as the monorepo.
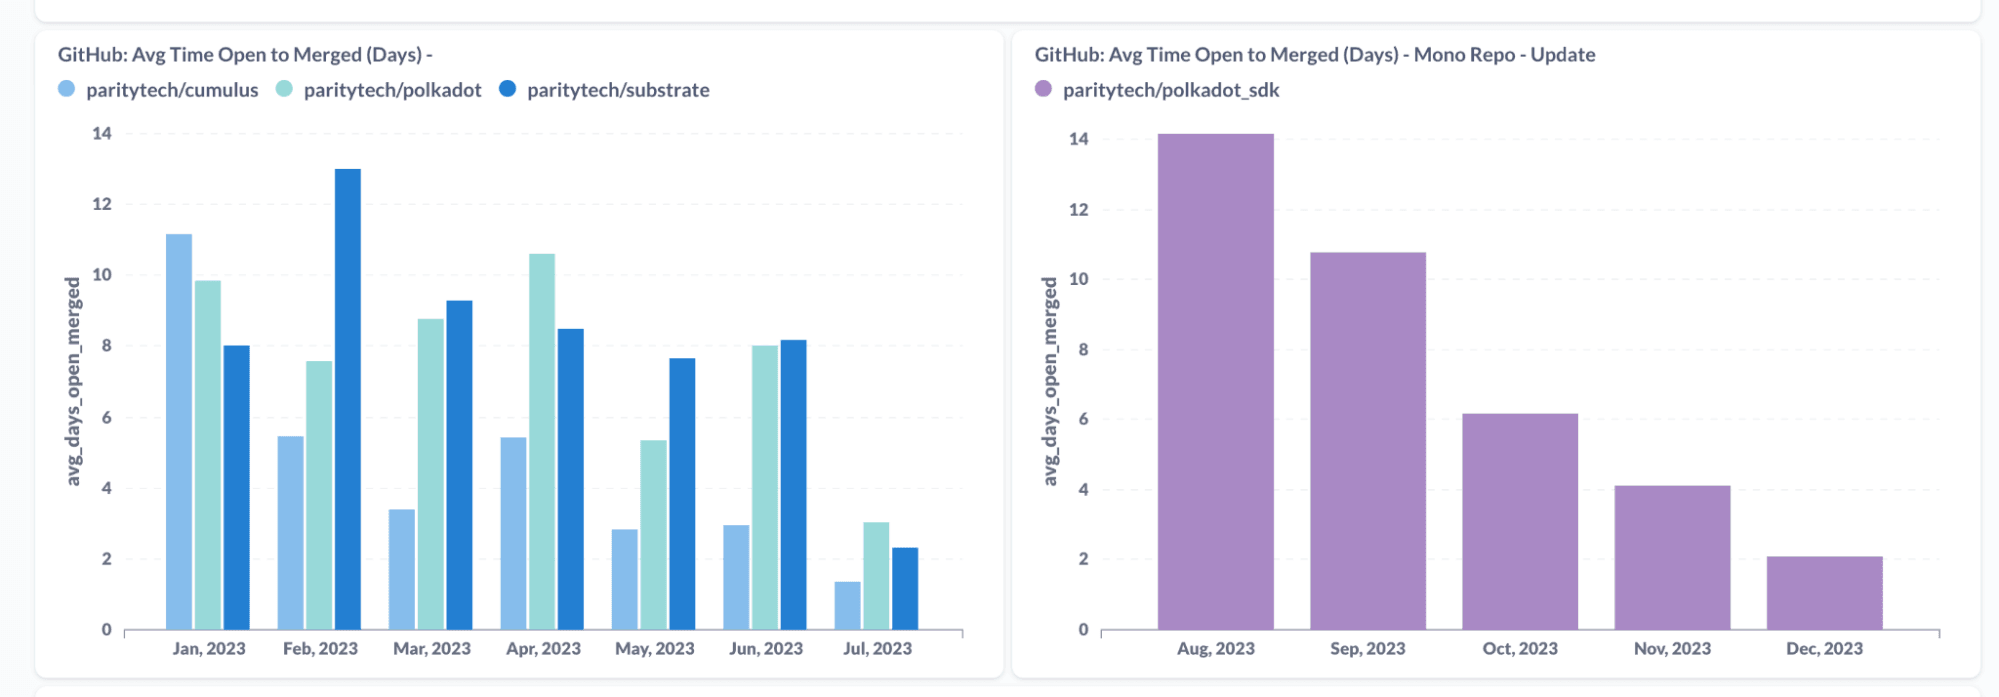
Reflecting on the past six months, it was evident that the three individual repositories demanded a considerably longer review period. Notably, Substrate PRs felt the pinch the most with an average open-to-merge duration stretching up to 13 days, and on average it wouldn’t be under eight days!
Looking at the graph, it's clear that our initial average pull request merge times in August were a bit elongated. But let’s consider the effect of vacation at this time of year 🌴 plus the time to adapt to a new codebase and new processes. The Polkadot SDK monorepo shows that focusing on one thing helps reduce open-to-merge by 25% every month consistently, proving enhancements in development velocity and efficiency.
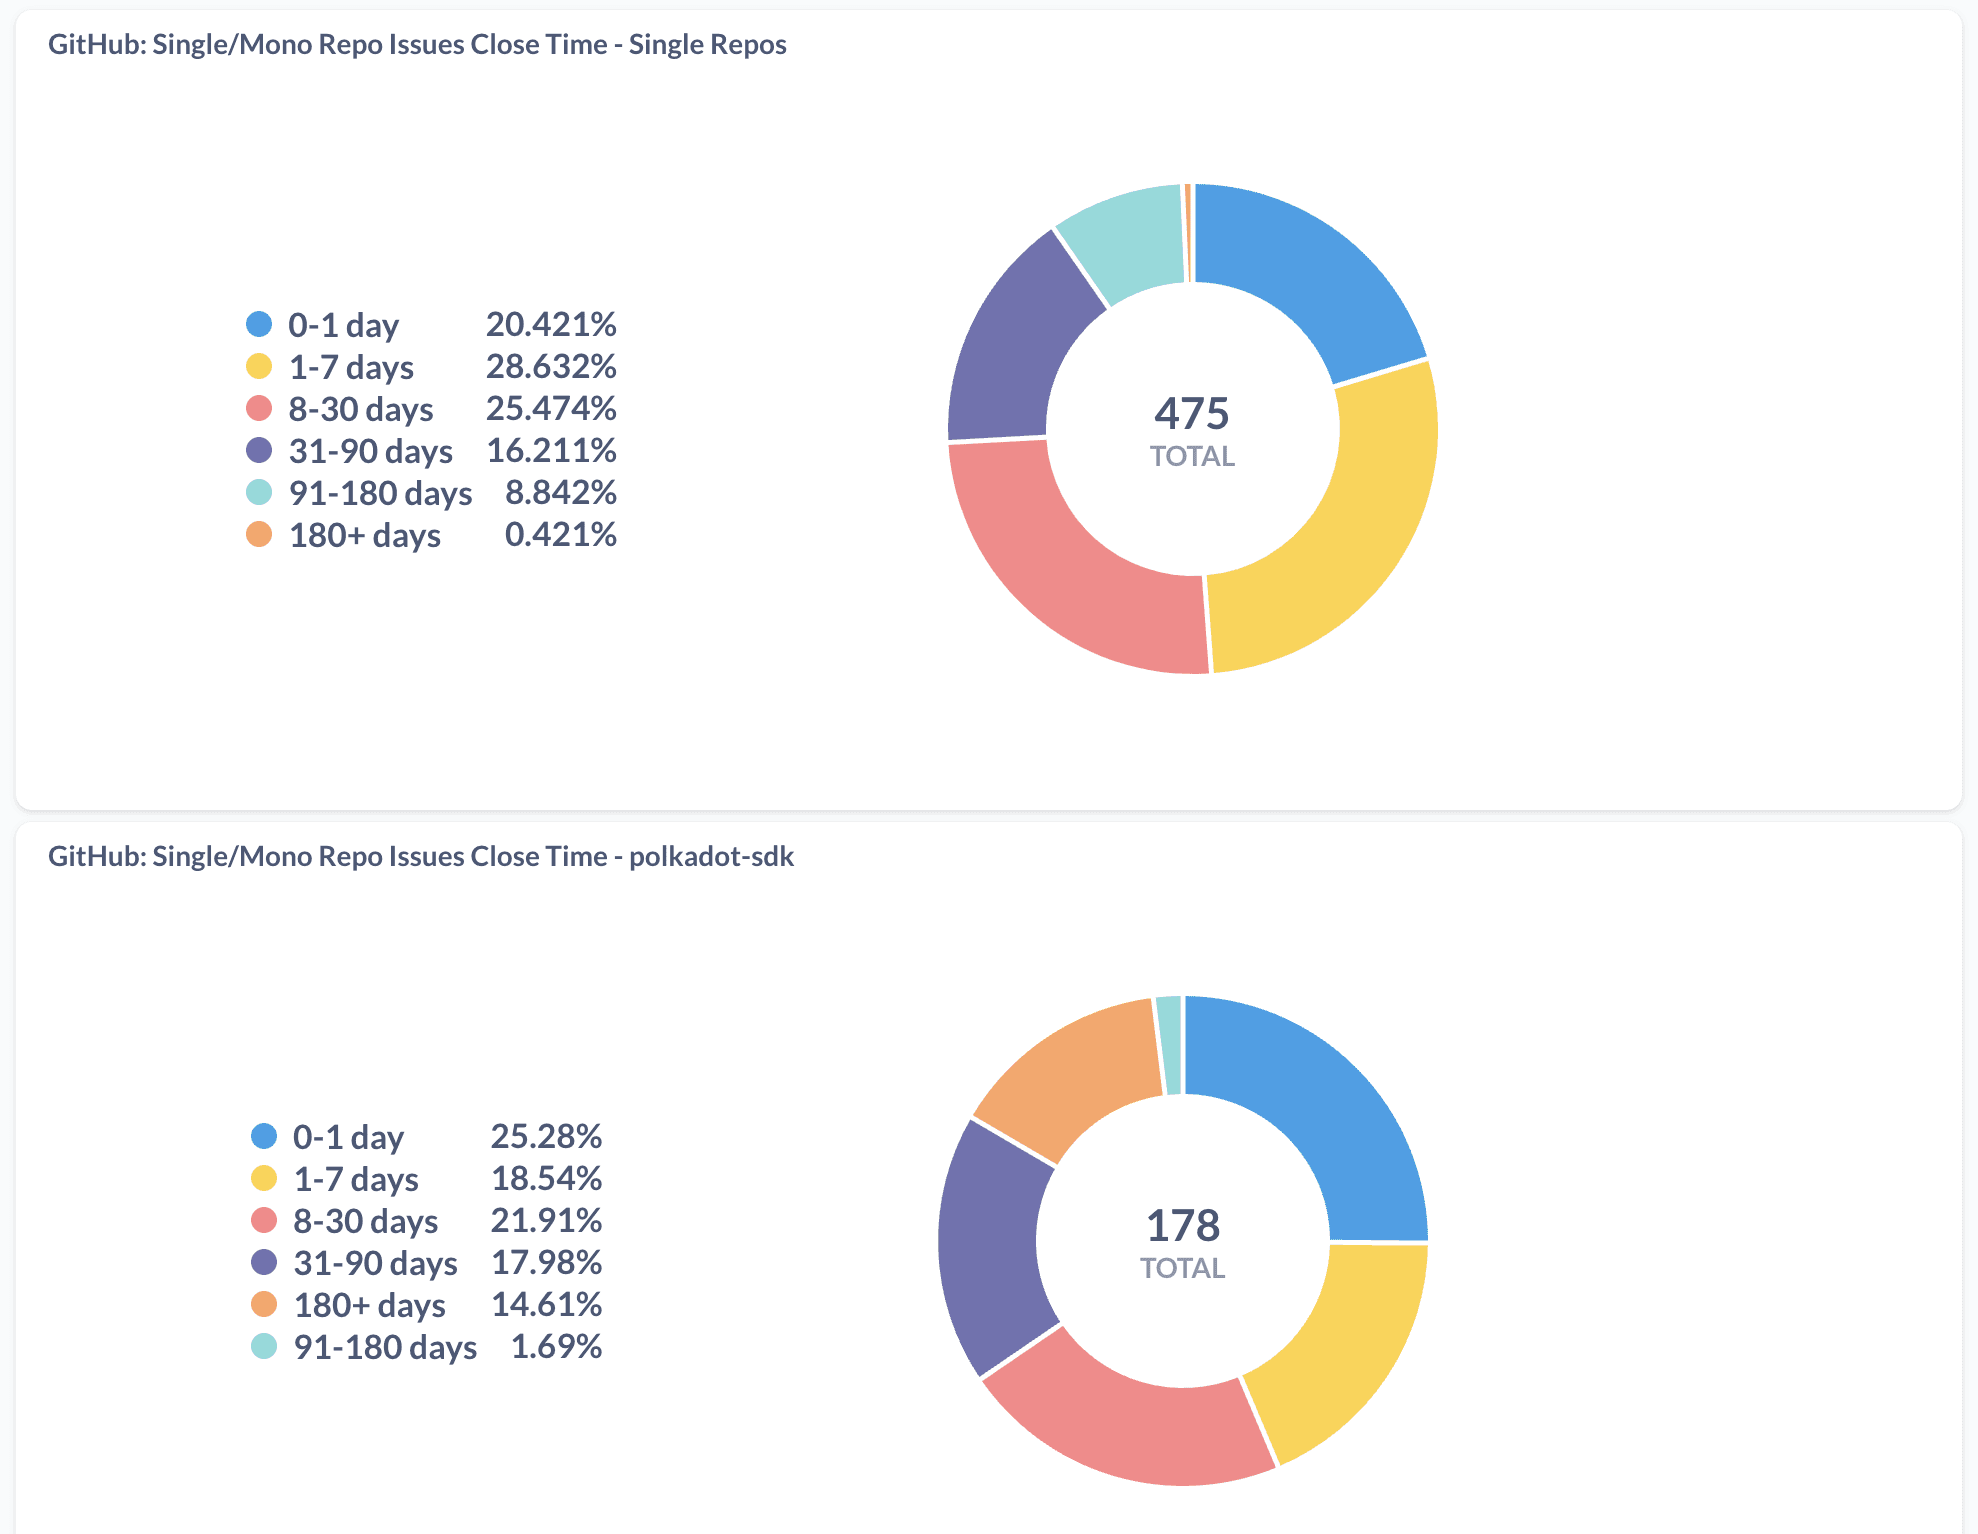
Not only have we become faster, 25% of our issues are closed within a single day, which is 5% more than before when we were all spread out working in different repos.
Getting rid of the companion system and having all related changes in one Pull Request makes it not only easier for you to submit code, but also for us to review them. This will save you and us a lot of time that can be devoted to what really matters: coding 🤠

When it comes to companion PRs themselves, the number would always vary but some months had almost 30 companion PRs to review. This also justifies the extended time that the team would need in order to review those PRs.
A significant yet potentially misleading indicator is the number of merged Pull Requests. We demonstrated enhanced efficiency in merging Pull Requests when the repos were distinct from one another. The contributions were dispersed, but during some fruitful months we managed to merge more than 280 Pull Requests monthly. However, does the sheer volume of Pull Requests genuinely reflect our working efficiency? 🧐 Feel free to form your own opinion on this. For now, here’s the data:
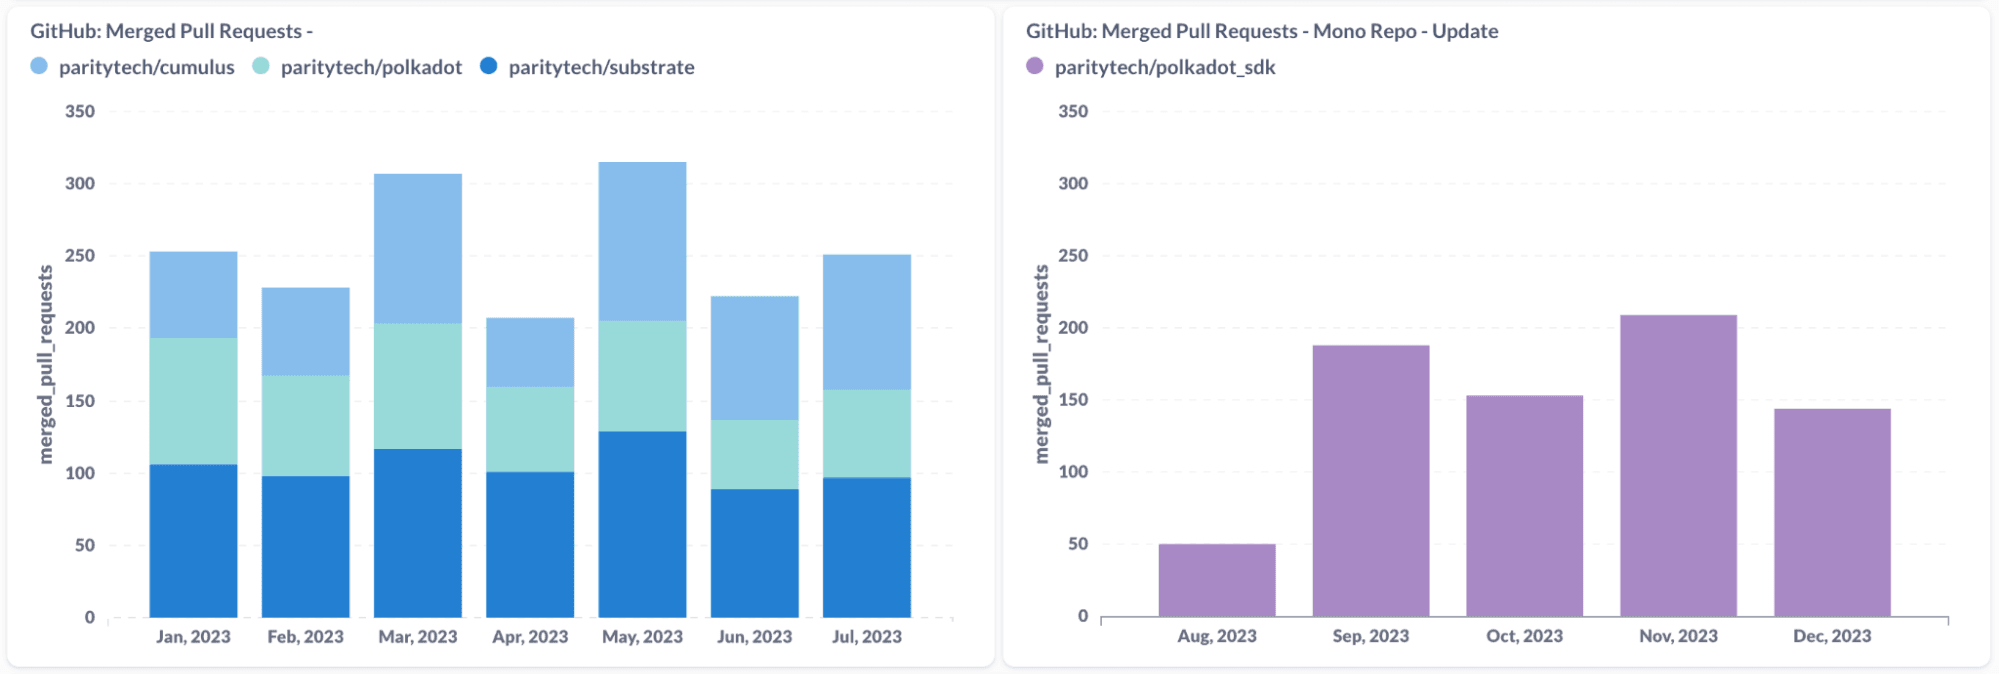
What I’ve learned from reading this data is that even if we are now merging fewer Pull Requests, we’re in fact solving more problems than before.
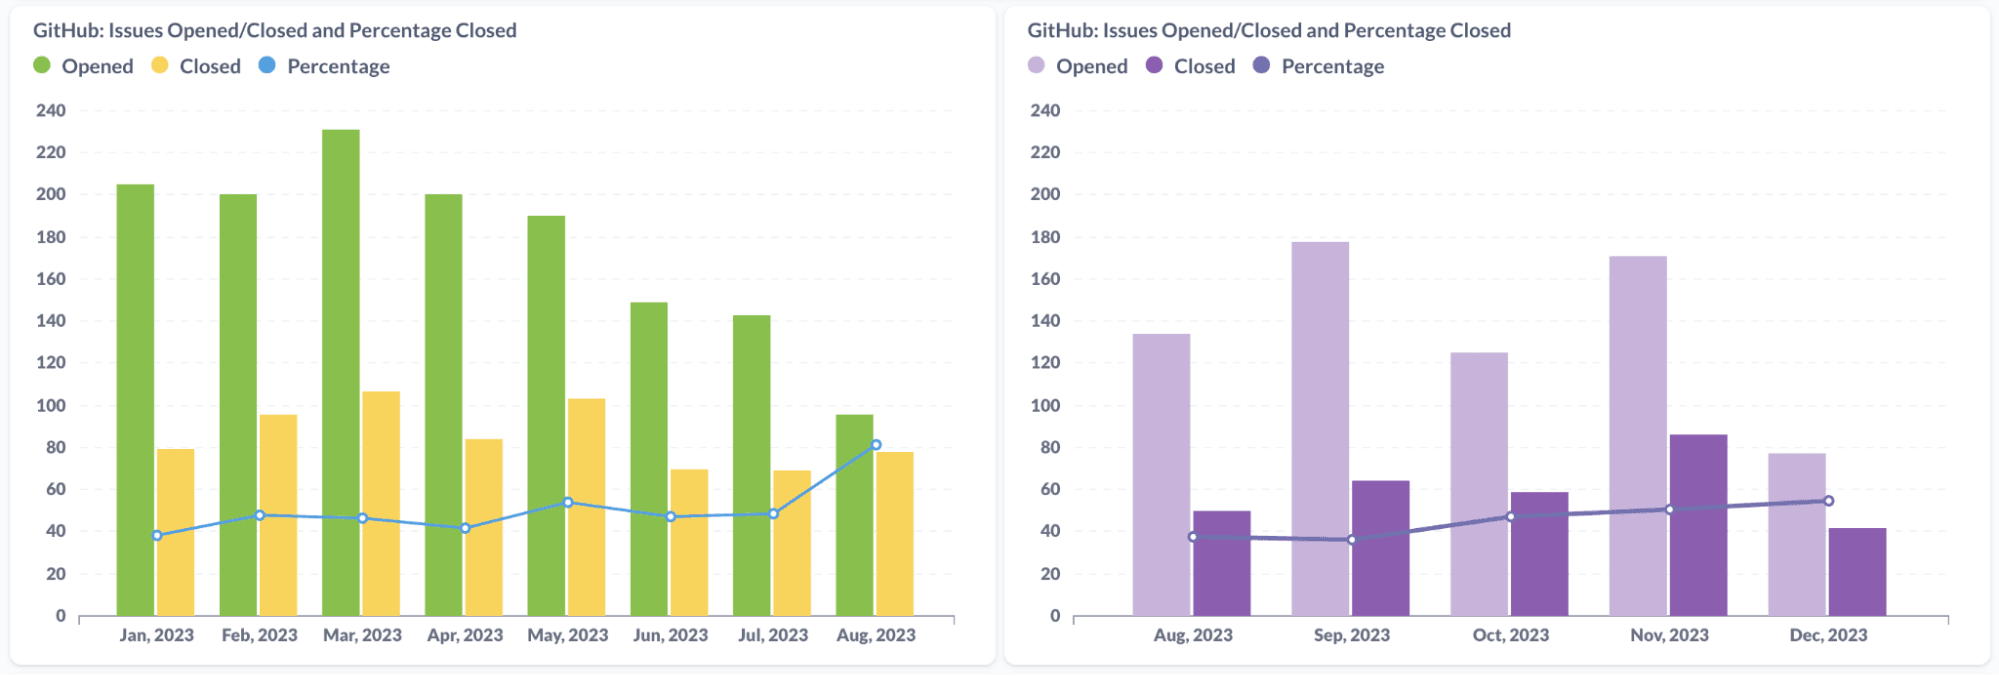
If you look into the last diagram we successfully solved on average between 50-55% of all issues opened throughout the last period. Before, we only solved between 39% and 48% of the opened issues per month. This number would only come close to our lucky 55% in one month (which was in this case May).
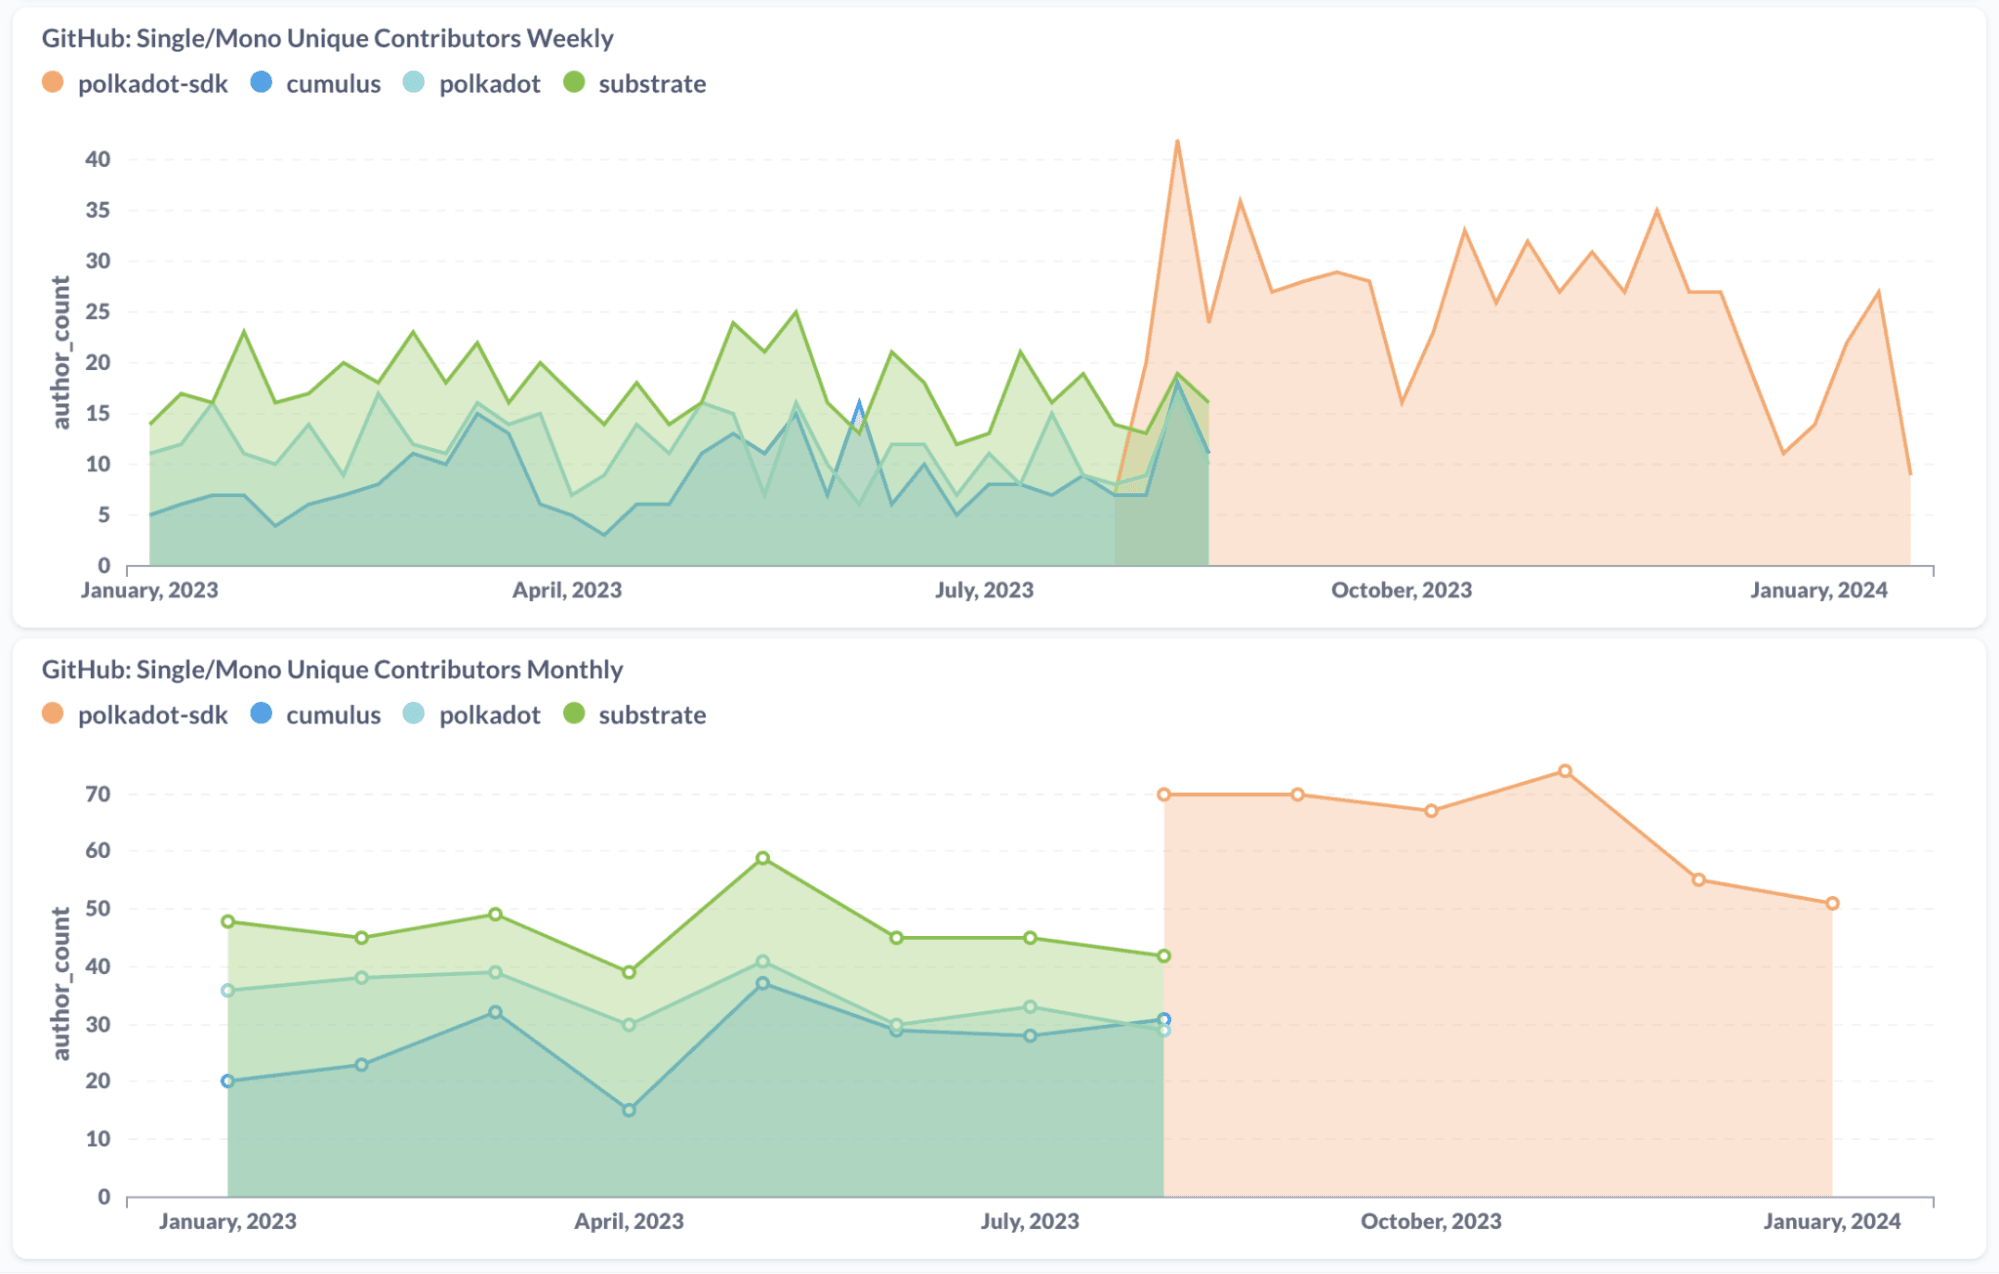
Since moving to the monorepo, our community has come closer together. When in the past everyone would work in their own silo, looking specifically into the code they knew, today we bring all contributors together and this (hopefully) brings new synergy, exchange of information within the community and growth for Polkadot.

And with that being said, this is also all what we’ve got for today. Shout out to Marek Hakala and William Stevenson for providing the sexy dashboards. We hope you enjoyed it and we’re looking forward to giving you many more juicy insights about Polkadot and its development.
Stay tuned for more! ✌️


